


We don’t need sophisticated Machine Learning to know that many products in Ecommerce are seasonal – we buy swimsuits in the summer and jackets in the winter, scuba diving equipment in May and snowboards in October.
If you chart how product categories in a digital shop change over the course of a year, you’ll quickly realize that items are aptly added/removed by merchandisers to follow these obvious seasonal patterns.
However, something that is far less clear is that different people experience seasons differently. Sure, we all buy swimsuits in “the summer”, but “summer” in Charleston feels different than “summer” in Montreal.

This then begs an important question: if a North American Ecommerce shop adds swimsuits in April, will Canadian shoppers start buying them as soon as shoppers in North Carolina, or will they wait until it “feels like summer”?
The above inquiry indicates that weather could potentially have an impact on buying behavior and, therefore, is a factor worth considering on our journey towards hyper-personalization (previous points on this journey are explored here and here). The research question we will put forward is as follows: if we know where a shopper is when browsing or issuing a query, can variations in local weather help us better predict their behavior?
In this blog post, we explore this question and aim to draw some intriguing preliminary conclusions.
NERD NOTE: This work was produced in collaboration with Nadia Labai, who was our AI intern last summer. She did most of the work, and any mistakes that remain are ours.
A data-driven definition of “seasonal”
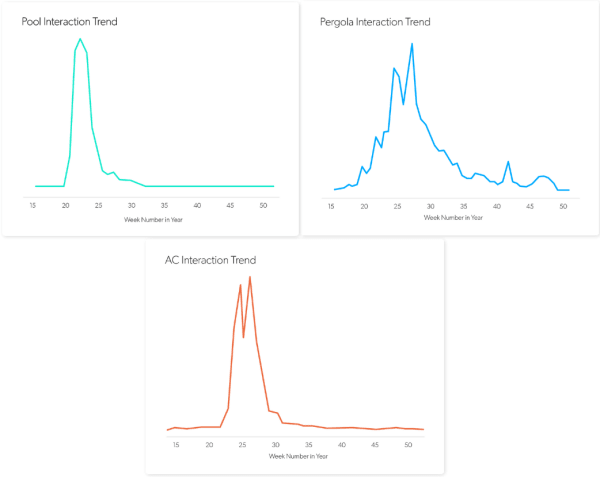
First, we need to narrow down our analysis to “generic seasonal products”. While local variations are, in theory, possible for any item, it is convenient to start our exploration with products whose popularity we know for certain depends on weather: pools, pergolas, and air conditioners. These are all items that we would expect to be in high-demand in the summer and low-to-zero-demand in the winter.
The dataset we’ll be analyzing in this case consists of 12 months of anonymized behavioral shopping data from a partnering shop – every product that was viewed, bought, and clicked was meticulously tracked and standardized by our machine learning pipeline.
Now, we consider an item to behave seasonally if we can detect a distinct peak in the consumers’ interest in the item; that is, most of the time, the interest in the item is low, but there is a relatively short period of time where the interest in the item rises significantly.
Below, we highlight interactional trends for our supposedly summer-centric products to see if they are indeed “seasonal”:
A quasi-experimental setting
Now that we have confirmed (thanks data!) that pools are indeed seasonal items, our task is to find out if there is any empirical evidence that supports the local climate hypothesis: do small, local variations in weather have a bearing on shopping interest for a product?

Our ideal situation is some sort of experimental setting: two groups with different local weather conditions at a given time interact with the target product class in different ways. Since all we have is past data, setting up a weather-based experiment is out of the question – so how do we check for climate influence? By taking advantage of the fact that multi-channel shops have a distributed shopping base that spans across the country.
In sufficiently large countries, such as the United States, companies that own physical shops and an Ecommerce store will attract digital shoppers from a variety of locations, with starkly different weather patterns. This means that there will be users browsing the same site at the same time while experiencing very different local weather, giving us the experimental setup we need.
That being said, let’s explore the wonderful world of air conditioners.
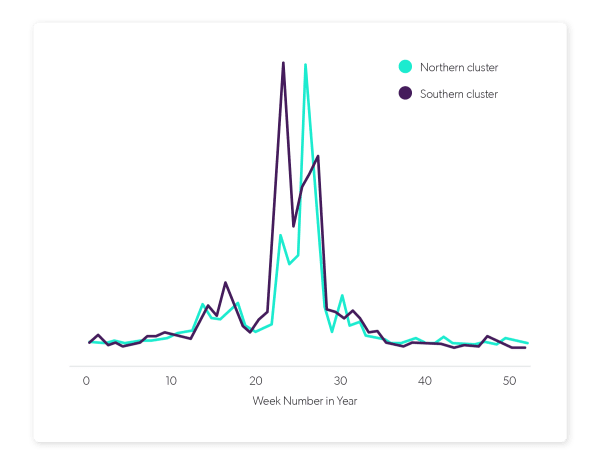
Below, we cluster the approximate physical location of digital shoppers in a Southern vs. Northern cluster for our shop (based in Italy), and draw the interaction chart once again: the south peaks two full weeks before the north!
To drive our point home, let’s now look at the temperatures around those times and overlay the plots:
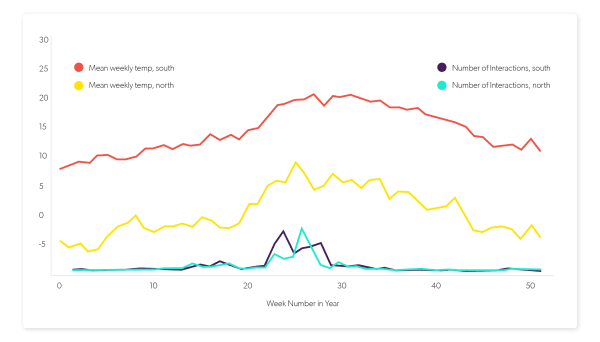
We can see that the peaks in air conditioner interactions, both for the north and the south, follow a sudden increase in temperature that crosses into “hot weather” territory – this would imply that people are more interested in ACs when it is hot.
The peaks can be appreciated even better on a map, such as the two below. The hexagons represent temperature (with the darker shade reflecting greater intensity), and the cylinders represent shopping interactions (with height reflecting the number of interactions). The maps, spaced two weeks apart, reveal that the south gets “summer” first, which leads to the corresponding AC peak, and then north follows in suit, when “summer” gets there as well:
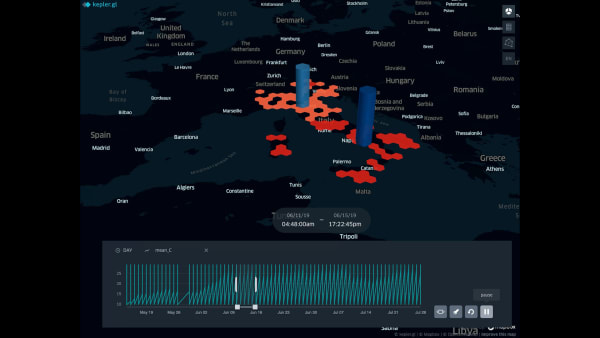
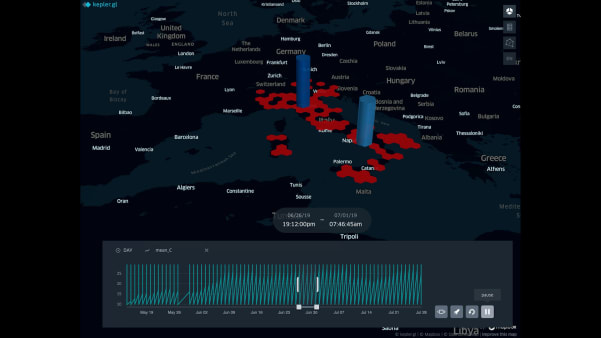
By animating the temperature changes and shopping interest for ACs over the course of the first weeks of summer, the delay between the two peaks (north vs south) are even easier to spot.
This is a very important point for Ecommerce owners – and for providers like us – so it makes sense to digest this a bit more: even if all shoppers have the same digital catalog at their disposal, their physical surroundings influence which items are more interesting to them at a given moment.
To deliver “real personalization”, the impact of weather must be taken into account. Individuals experiencing different weather have different needs at the same moment in time, and a digital shop must be able to adapt in order to provide them with what they need, when they need it.
Some like it hot
If you look at the above AC chart again, a fairly interesting phenomenon occurs which gives rise to an equally interesting question. As we explored above, shopper interest in ACs seems to correlate with the first “heat wave” (in their local weather). But why does it go back to almost baseline level immediately after?
The first wave occurs at the end of May, but weather still stays hot for three months after that. From a purely rational perspective, even if I don’t buy an AC in May, I should still want to buy it at the end of June to help me get through the rest of the summer. Right?
To decipher user behavior, we brought in an expert in decision making: our friend Andrea (lesson to young scientists: you’re almost always only as good as your network of friends!). As it turns out, there is extensive literature from psychology and decision sciences on what is called “consumer procrastination”, that is, the intentional delay of completing a task. Could it be that our AC peak is an instance of such behavior? That is, if I don’t buy an AC in May, I will wait until next May to reconsider this type of purchase?
To make sure we are comparing apples to apples, we need to control for obvious confounding variables (to the best of our ability). Perhaps, there is some marketing campaign going on in our shop which is driving shoppers to look at ACs within a specific time frame!
The first thing we can do is to conduct a quick sanity check to compare our results to what people do in general. If you jump on Google Trends to check for searches of ACs, you will indeed find a similar pattern to the one we found above (peaks occur at the same time!). Second, using our rich behavioral data, we trace users throughout their entire journey to see where they are coming from when they land on a seasonal item. The intuition here is that if marketing campaigns are responsible for the peak in popularity, we should see many direct paths between ads and the target seasonal item.
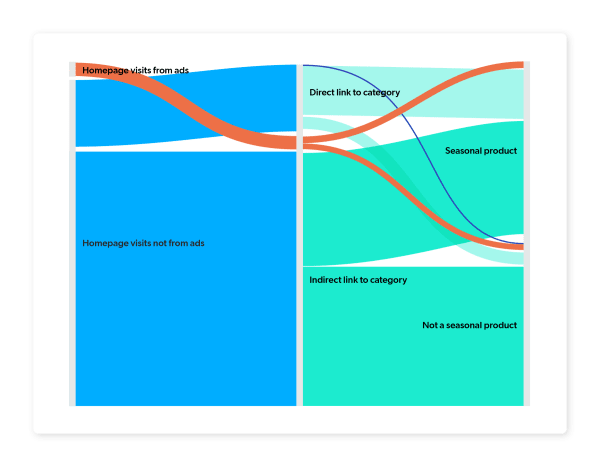
For this test, we’d like to focus our attention on shoppers who added a seasonal item to their basket (as adding to cart shows a stronger intention than just browsing). We can then check how many of those shoppers reached the website via an ad campaign, and moreover, how many of those ad-clicking shoppers were immediately directed to the seasonal items’ category once landing on the homepage. Put simply, we want to try to find shoppers whose experience on the website looked like:
Facebook Ad → Homepage → ACs → Add AC to basket
This reflects the behavior of someone who bought an AC as the result of ad influence. If we have many of these, it would seem reasonable that ACs are not truly a microseasonal item, and the sudden interest has more to do with the promotion than it does with the increase in temperatures. However, we can see in the chart below how traffic flows within the target website, going from left (the homepage) to right (the product pages). In particular, we can readily notice that very few shoppers immediately landed on a seasonal item. This likely means that they were not directed there by an ad but instead found their way on their own due to personal interest.
While we do know that analyzing shopping intentions is far trickier than it seems, all in all the evidence seems to suggest that even if there is a “marketing effect” on ACs trend, it is not the main explanation for the peak in AC interactions. [ NOTE: while it’s all good and fun and geek to look at the data, in the end we also “cheated” and asked directly our client if they had marketing initiatives for those two weeks! ].
Many more experiments would need to be run in order for us to make a more conclusive statement, but the evidence collected so far suggests at least some degree of “irrationality” in shoppers: they make a buy/not buy decision at the start of the summer, and then live with it until next year.
Can we build a better shopping experience knowing that?
See you, space cowboys
Now that we know that local climate has, to some extent, an influence on consumer behavior, the natural next step is going from description to prediction: if I am building a recommender system for seasonal items, will taking local weather into account allow me to be even more precise?
As we barely scratched the localization surface here, we look forward to deepening our understanding of all contextual factors in online shopping decisions. As usual with all ML-things, the sky is indeed the limit – possibly, a sunny one.
Finally, while grand contextual factors (like the weather) may be out of your control, there are a number of factors over which you can exert influence to ensure that customers find what they need when they need it – even for the outliers looking for an AC in February. Be sure to watch our bite-sized learning series “7 Turnoffs That Make Shoppers Abandon You” to find out what’s driving customers away and how to make them stay.
Acknowledgments
Thanks to Andrea for lending us his experience in behavioral economics and air conditioners!